OpenTelemetry (OTel): Unified Observability, Simplified (Part 2)
To get understanding on html/css click here
Table of Contents
- Understanding OTel’s Schema, SDK Objects and OTel’s components
- Why Use OpenTelemetry SDKs?
- OTEL Components and How Does OpenTelemetry Work?
- Specification or Standard — The Rulebook (Schema Definitions + Semantic Conventions))
- Data Model — This Is the Schema part implemented in protobuff
- API — This Is the Interface (not the implementation)
- SDK — Implements Interface + Handles Schema Generation
- Instrumentation Libraries (optional but common)
- Exporter in OpenTelemetry
- Collector (optional, but common)
- Observability Backends
- OpenTelemetry Protocol (OTLP)
- OTel’s Standard (Schema) = Data Models (strict Schema) + Semantic Conventions
- Mental Model of the schema
- Minimal Python code examples for getting the console output
- Trace Context Propagation Across Distributed Systems: How It Works
Understanding OTel’s Schema, SDK Objects and OTel’s componets
Why Use OpenTelemetry SDKs?
Sure, you could manually read the OTel spec, construct trace schemas field by field (trace IDs, span timings, nested attributes), serialize it in Protobuf, and push it over the wire… 😵💫 But why go through all that? OpenTelemetry SDKs do the heavy lifting for you:
- Auto-generate valid telemetry data (
traces,metrics,logs) ,Handle IDs, timestamps, and span relationships - Follow OTel spec and ensure OTel-compliant, backend-ready data
- Expose simple APIs to add custom attributes and Work across languages.
Use pip to install the OpenTelemetry SDK, API, and a console exporter:
1
2
3
pip install opentelemetry-api
pip install opentelemetry-sdk
pip install opentelemetry-exporter-console
Think of SDKs as your bridge between application logic and observability infrastructure — abstracting complexity while enforcing standards. You focus on your app. The SDK handles the schema.
OTEL Components and How Does OpenTelemetry Work?
OpenTelemetry is built from modular components that work together to collect, process, and export telemetry data (traces, metrics, and logs). Let’s walk through the core components (The specification and OpenTelemetry pipeline):
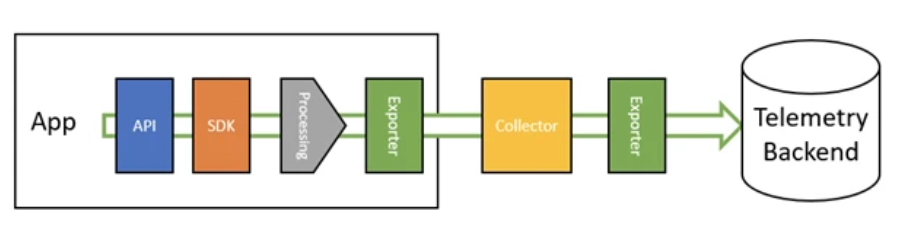 OpenTelemetry Components (Source: Based on OpenTelemetry: beyond getting started)
API -> SDK -> Expoter -> Backend
Specification or Standard — The Rulebook (Schema Definitions + Semantic Conventions)
OpenTelemetry: Two Layers
| Layer | What is it? | Where is it defined? | Is it enforced? | Purpose |
|---|---|---|---|---|
| 1. Protocol/Data Model Schema | The structure of telemetry data (spans, traces, metrics, logs) | ✅ In opentelemetry-proto (.proto files) | ✅ Yes — strict (protocol-level) | Ensures serialization, transport, and storage can work |
| 2. Semantic Conventions | Meaning of attribute keys (e.g., http.method, db.system) | ✅ In the semconv spec | ❌ No — convention only | Enables backends and UIs to interpret, visualize, and analyze data meaningfully |
The OpenTelemetry Specification is not a schema itself, but rather:
- A standardized description of how telemetry should be structured and produced
→ Kind of like an RFC or PEP guideline. - The Schema defines how a trace or a metric or a log is structured.These data models include metadata that uniquely identifies them as a trace, metric, or log ,along with a flexible attributes section that carries the actual application or system-related data.
- Semantic Conventions define how attributes should carry data with agreed-upon meanings.
- While attributes can hold any key-value pairs (e.g.,
{ "x": 123 }), arbitrary keys like"x"are valid structurally but carry no universal semantic meaning. - In contrast, well-known semantic keys such as
"db.system": "postgres"or"http.status_code": 200have specific, agreed meanings that all tools recognize.These conventions serve as guidelines. - If we define custom attribute keys like
"my.custom.key": "value", our backend should understand it as Generic backends might not
Example langfuse has its own custome attributes like
scorethat the langfuse backend only undestandsExample JSON Attributes (with inline comments)
1
2
3
4
5
6
7
8
9
{
  "attributes": [
    { "key": "http.method", "value": { "stringValue": "GET" } },            // Semantic convention: HTTP method used
    { "key": "http.status_code", "value": { "intValue": 200 } },           // Semantic convention: HTTP response status code
    { "key": "db.system", "value": { "stringValue": "postgres" } },        // Semantic convention: Database system type
    { "key": "my.custom.key", "value": { "stringValue": "custom_value" } },// Custom key, may need backend support
    { "key": "x", "value": { "intValue": 123 } }                           // Arbitrary key, no semantic meaning
  ]
}
- While attributes can hold any key-value pairs (e.g.,
- Only the OpenTelemetry specification committee can modify these schemas
→ This ensures long-term stability and interoperability.
👉 It ensures cross-language consistency, but does not act as the schema or implementation.
Data Model — This Is the Schema part implemented in protobuff
The Data Model is the actual schema for telemetry in OpenTelemetry.
It defines:
- ✅ What a trace, span, metric, or log looks like
- ✅ Required fields (e.g.,
trace_id,span_id,start_time) - ✅ How signals relate (e.g., parent/child spans, metric resources)
- ✅ How to represent them in formats like OTLP (Protobuf / JSON)
✔️ This is what SDKs and backends serialize and store.
It’s the canonical structure your telemetry data must follow.
Examples click here for exact schemas and understandings
- Span schema:
trace_id,span_id,name,start_time,attributes[] - Metric schema:
instrumentation_scope,value,unit,timestamp - Log schema:
severity,message,trace_id,attributes[]
API — This Is the Interface (not the implementation)
The API is the language-specific interface exposed to developers.
It defines:
- How your application interacts with OpenTelemetry (e.g.,
start_span(),set_attribute()) - Does not contain logic for export, batching, or transport
- It’s defined in the spec but implemented per language
SDK — Implements Interface + Handles Schema Generation
The SDK:
- Implements the API (i.e., it’s the actual logic behind the interface)
- Generates telemetry data based on the data mode
- Handles:
Span lifecycle,Context propagation,Sampling decisions,Exporter communication - Encoding data per the OTEL data model and sending it via exporters (typically using OTLP)
This is the implementation layer that uses the data model schema to build and emit the correct telemetry.
Instrumentation Libraries (optional but common)
Pre-built packages that auto-instrument popular frameworks and libraries (e.g., Flask, Django, HTTP clients, databases).
They remove the need to manually write spans.
🔌 Plug-and-play observability for common tools in your stack.
Exporter in OpenTelemetry
An Exporter is a component within the SDK that:
- Takes the telemetry data generated by the SDK (spans, metrics, logs)
- Formats that data into a specific schema/encoding (e.g., OTLP, JSON, console)
Sends (exports) it to:
- A backend system (e.g., Jaeger, Prometheus, Tempo, Datadog)
- Or a user-readable output (e.g., terminal, file)
Purpose
1
  AppCode -- API --> SDK --> Exporter --> Backend
How it works:
- SDK builds raw telemetry data objects (structured per the OTEL data model)
- The Exporter:
- Parses these SDK objects –> Encodes them (Protobuf, JSON, etc.) –> Transmits them (over HTTP, gRPC, or prints to console)
Types of Exporters
- 🖥️ Console / Debug Exporters
- Output telemetry in human-readable format,Used for development/testing
- Examples:
ConsoleSpanExporter,LoggingMetricExporter - Output: JSON or plain text
- 🛰️ OTLP Exporters (Protobuf or JSON)
- Use OTLP (OpenTelemetry Protocol), the official wire format, Preferred for production systems
- Can transmit via gRPC or HTTP
- Output: Strict schema,
binary (Protobuf) or JSON
Typically sent to:
- OpenTelemetry Collector
- Jaeger, Tempo, etc.
Collector (optional, but common)
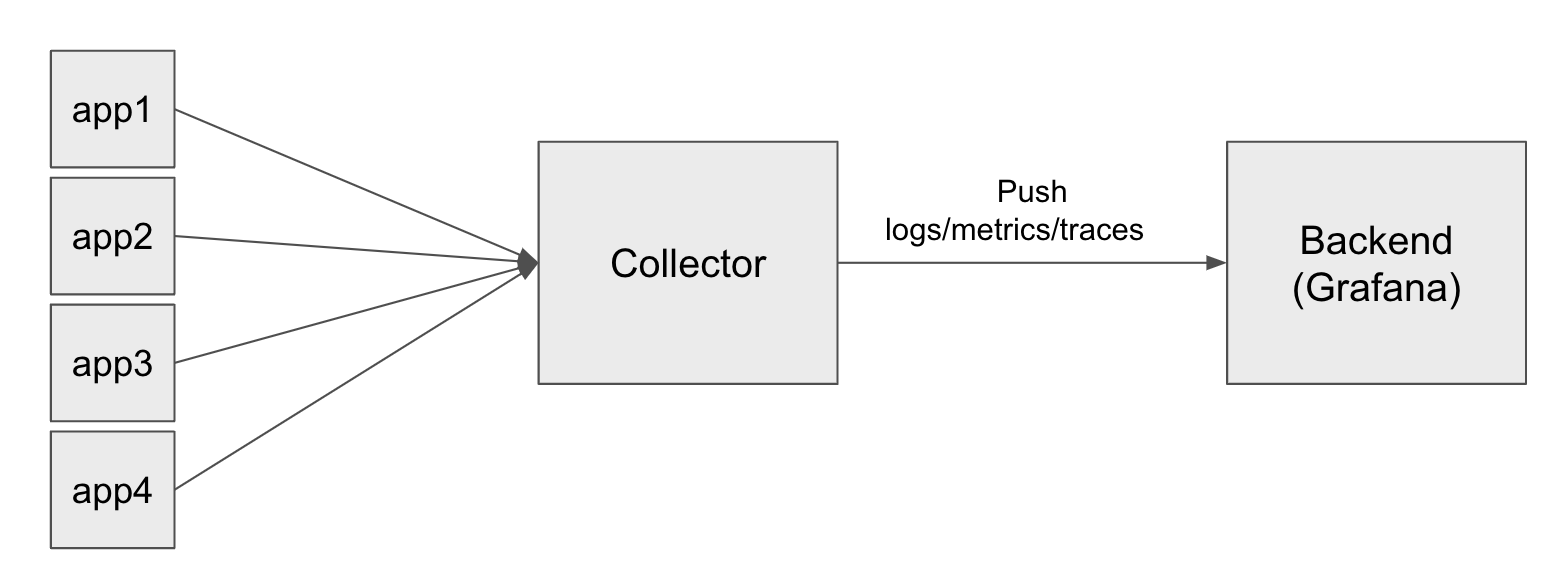
A standalone service that acts as a central telemetry hub. It receives telemetry (from SDKs or agents), optionally processes or transforms it, and then sends it to one or more backends.
- Ingest from SDKs / Exporters, Apply filtering, enrichment, redaction, Forward to observability platforms,
- Exports to one or more backends (e.g., Jaeger, Prometheus, Elasticsearch, etc.)
Observability Backends
This is where the telemetry data ends up — the final destination for storage, analysis, and visualization.
Examples:
- Jaeger / Tempo → Distributed tracing
- Prometheus / Grafana → Metrics dashboards
- Loki / ELK → Log search and analysis
- Datadog / New Relic / Dynatrace → Commercial all-in-one platforms
OpenTelemetry Protocol (OTLP)
A standardized transport format used to transmit telemetry data between:
- SDK/expoter ➝ backend
- SDK/Expoter ➝ Collector
- Collector ➝ Backend
Supports both gRPC and HTTP.
Efficient, binary, and supported by many major vendors like Jaeger, Datadog, Tempo, etc. It’s the “language” OpenTelemetry speaks to move telemetry around.
OTel’s Standard (Schema) = Data Models (strict Schema) + Semantic Conventions
In OpenTelemetry, the standard schema consists of two key parts:
Strict Protocol/Data Model Schema: trace, metric, and log
For details on below refer here
These are formally defined structures for telemetry data types like trace, metric, and log.
They are strictly versioned and defined in the OpenTelemetry Protocol (OTLP) using Protobuf, specifying exact formats, field names, and types.This is the actual data model layer
Protocol Schema = Strictly Enforced
- Defined in
.protofiles (trace.proto,metrics.proto, etc.). - This defines how data is structured — e.g., how a telemetry payload for a
traceor ametricshould look like (the exact key value paiers). - This is The exact structure that is transferred over HTTP/gRPC must match the schema defined in the
.protofiles. - Also defines What is optional or extensible (like
attributes[])
Example
- So here the
Spanhasattributes, which are just key-value pairs.- NOTE :: 👉 If your telemetry payload doesn’t match this
.protoSchema, the receiving system will reject or error out.
✅ The protobuf doesn’t enforce http.method or db.system — you’re expected to follow the semantic conventions manually.
Where Are These protocol Schemas Defined? The canonical source of truth is in the opentelemetry-proto repository:
➡️ https://github.com/open-telemetry/opentelemetry-proto
Key Protobuf files: [CLICK ME]
opentelemetry/proto/trace/v1/trace.proto– Trace data (spans) DefinesSpan,SpanKind,Event,Link, etc.opentelemetry/proto/metrics/v1/metrics.proto– Define the structure for metrics dataopentelemetry/proto/logs/v1/logs.proto– Define the structure for logs dataopentelemetry/proto/common/v1/common.proto– Shared types (e.g., attributes) DefinesKeyValue,AnyValue, and other shared typesopentelemetry/proto/resource/v1/resource.proto– Telemetry resource data DefinesResource, which holds identifying attributes (e.g., service name)
Semantic Conventions
These are agreed-upon attribute keys and meanings (e.g., http.method, db.system) used within the flexible fields like attributes inside the protocol schema . They are not enforced, but following them ensures consistency and interoperability across tools and backends.
Semantic Conventions = Not Enforced, Just Agreed Upon
These are agreed attribute keys and expected value types. rules for what attributes should be used and what they mean.
Examples:
http.method = "GET"
db.system = "mysql" cloud.region = "us-east-1"
🟨 we can define our own:
These attributes are sent along with the span data in the standard Protobuf/JSON format:
- ✅ The custome ones are accepted by the SDK and backend, because they’re valid KeyValue pairs. (Valid according to the
.proto)- ❌ But not “understood” semantically or Not meaningful to OTel collectors/dashboards unless configured in tools like Jaeger, ot out own
That means (A comparision):
| Tool | Will it display your custom key? | Will it interpret it meaningfully? |
|---|---|---|
| Jaeger | ✅ Yes (raw view) | ❌ No (no special UI treatment) |
| Grafana Tempo | ✅ Yes (as attribute) | ❌ No (no special filtering or panels) |
| Honeycomb | ✅ Yes | ❌ No |
| Langfuse (if used) | ✅ Maybe | ✅ If you follow Langfuse semantics |
Examples of Semantic Conventions (Standard Names)
Here’s a mini reference of standard attribute keys (a sampling):
HTTP Semantics
| Key | Example |
|---|---|
| http.method | “POST” |
| http.url | “https://…” |
| http.status_code | 200 |
| http.request.body.size | 342 |
DB Semantics
| Key | Example |
|---|---|
| db.system | “postgresql” |
| db.statement | “SELECT * FROM users” |
| db.user | “admin” |
Messaging Semantics
| Key | Example |
|---|---|
| messaging.system | “kafka” |
| messaging.destination | “user-topic” |
Cloud Infrastructure
| Key | Example |
|---|---|
| cloud.provider | “aws” |
| cloud.region | “us-west-2” |
🤔 Some Questions About OTel’s Schema — Answered
What parts of the OTEL schema are fixed?
The schema itself (the “shape” of the JSON/Protobuf message) is fixed and standard.
That means:
- Top-level objects (
resourceSpans,scopeSpans,spans, etc. for traces) - Required fields like
traceId,spanId,name,startTimeUnixNano,endTimeUnixNano - Data types (
stringValue,intValue, etc.) You cannot change these keys.
Every backend (Jaeger, Tempo, Honeycomb, Langfuse) expects exactly this structure.The only this that is not fixed is the
atributeparts where we can define cusome or our own key cvalue pairs Rrem : this is also defined but not enfored
What parts are your custom data?
name→ You set this. Example:"HTTP GET /users/:id""sub-step-1""generate-embedding"
OTEL doesn’t decide this — you (or the SDK instrumentation) do.
attributes[]→ This is the official “escape hatch” for custom metadata.- Example:
1
2
3
4
"attributes": [
  { "key": "user.id", "value": { "stringValue": "alice" } },
  { "key": "langfuse.observation.input", "value": { "stringValue": "{\"x\": 5}" } }
]
- Example:
🔥 This is where Langfuse puts its extra stuff (langfuse.observation.input/output). 🔥 You can add any key/value here, as long as the type is one of the allowed OTEL types (string, int, double, bool). There are semantic conventions for this as well , like
db.sytemand all but not enforced
What Parts Are Auto-Generated?
traceId,spanId,parentSpanId→ Generated by the OTEL SDK (unless overridden)startTimeUnixNano,endTimeUnixNano→ Captured from system time by the SDKkind→ Defaults toSPAN_KIND_INTERNAL, but can be set (e.g.,SERVER,CLIENT,PRODUCER, etc.)status→ Set by the SDK (OK,UNSET,ERROR), but can be overridden
Example: Your custom + auto-generated mix [click to expand]
1
2
3
4
5
6
7
8
9
10
11
12
13
14
15
    {
      "traceId": "4fd0c9e6e9c6bfb1a5f7d29d6c72b78f",   // auto
      "spanId": "6f9c2d7f8c4d1f32",                   // auto
      "parentSpanId": "0000000000000000",             // auto/unset
      "name": "generate-embedding",                   // YOU set
      "kind": "SPAN_KIND_INTERNAL",                   // default, can set
      "startTimeUnixNano": "1692288000000000000",     // auto
      "endTimeUnixNano": "1692288001000000000",       // auto
      "attributes": [                                 // YOU add custom metadata
        { "key": "user.id", "value": { "stringValue": "alice" } },
        { "key": "langfuse.observation.input", "value": { "stringValue": "{\"text\": \"hello\"}" } },
        { "key": "model.name", "value": { "stringValue": "gpt-4" } }
      ],
      "status": { "code": "STATUS_CODE_OK" }          // default, can set error
    }
Why do I see different outputs when printing telemetry data locally in the console?
There are two different “shapes” of data you can see when working with OpenTelemetry in Python (or any language SDK):
before proceding lets clarify ,there are two exporters you can use with the official OpenTelemetry Python SDK:
- ConsoleSpanExporter (debugging) → prints a Python dict-like view, not OTLP JSON.
(This is the “not real one” . it will provide the debuging easy representation , its SDK based) - OTLPSpanExporter (real exporter) → serializes spans to OTLP Protobuf (or OTLP JSON if configured).
(This is what actually goes on the wire to backends.)
Python SDK internal span JSON (what you saw)
This is SDK’s debug object: [click to expand]
1
2
3
4
5
6
7
8
9
10
11
12
13
14
15
16
17
18
19
20
21
22
23
24
25
26
27
28
29
30
31
    {
      "name": "sub-step-2",
      "context": {
        "trace_id": "0xd7600c1fd184882182df981dbcfe87dd",
        "span_id": "0x0f439fcbbe08d582",
        "trace_state": "[]"
      },
      "kind": "SpanKind.INTERNAL",
      "parent_id": "0xbcb606e5707fc548",
      "start_time": "2025-08-17T18:41:57.054572Z",
      "end_time": "2025-08-17T18:41:57.054848Z",
      "status": {
        "status_code": "UNSET"
      },
      "attributes": {
        "langfuse.observation.input": "{\"msg\": \"hello\"}",
        "langfuse.observation.type": "span",
        "langfuse.observation.output": "{\"msg\": \"world\"}"
      },
      "events": [],
      "links": [],
      "resource": {
        "attributes": {
          "telemetry.sdk.language": "python",
          "telemetry.sdk.name": "opentelemetry",
          "telemetry.sdk.version": "1.36.0",
          "service.name": "unknown_service"
        },
        "schema_url": ""
      }
    }
This is not the standard schema, just the SDK’s internal representation (Span + SpanContext). This will be showns if we use the debugging expoter
ConsoleSpanExporter
OTLP JSON that actually gets sent on the wire When the OTLP exporter serializes, it must follow the trace.proto schema.
The same span above looks like this (JSON view of Protobuf):
The same span above looks like this (JSON view of Protobuf): [click to expand]
1
2
3
4
5
6
7
8
9
10
11
12
13
14
15
16
17
18
19
20
21
22
23
24
25
26
27
28
29
30
31
32
33
34
35
36
37
38
39
40
  {
    "resourceSpans": [
      {
        "resource": {
          "attributes": [
            { "key": "telemetry.sdk.language", "value": { "stringValue": "python" } },
            { "key": "telemetry.sdk.name", "value": { "stringValue": "opentelemetry" } },
            { "key": "telemetry.sdk.version", "value": { "stringValue": "1.36.0" } },
            { "key": "service.name", "value": { "stringValue": "unknown_service" } }
          ]
        },
        "scopeSpans": [
          {
            "scope": {
              "name": "opentelemetry.sdk.trace"
            },
            "spans": [
              {
                "traceId": "d7600c1fd184882182df981dbcfe87dd",
                "spanId": "0f439fcbbe08d582",
                "parentSpanId": "bcb606e5707fc548",
                "name": "sub-step-2",
                "kind": "SPAN_KIND_INTERNAL",
                "startTimeUnixNano": "1692288117054572000",
                "endTimeUnixNano": "1692288117054848000",
                "attributes": [
                  { "key": "langfuse.observation.input", "value": { "stringValue": "{\"msg\": \"hello\"}" } },
                  { "key": "langfuse.observation.type", "value": { "stringValue": "span" } },
                  { "key": "langfuse.observation.output", "value": { "stringValue": "{\"msg\": \"world\"}" } }
                ],
                "status": {
                  "code": "STATUS_CODE_UNSET"
                }
              }
            ]
          }
        ]
      }
    ]
  }
This is the strict OTEL schema every backend understands This JSON structure follows the canonical
trace.protoschema and is exactly what every OpenTelemetry-compliant backend expects — including Jaeger, Tempo, Langfuse, Honeycomb, and others. Notice the key differences:
context.trace_id→ flattened into"traceId"parent_id→ becomes"parentSpanId"attributes→ always an array of key/value pairs, not a dictionaryresource→ exists at the resourceSpans level, not inside each spanTime fields→ represented in Unix nanoseconds, not ISO 8601 strings
This strict structure ensures consistent parsing, visualization, and correlation of spans across all OpenTelemetry tools and systems.
How the OTLP Exporter Maps Internal Python Span → OTEL Schema: [click to expand]
The OpenTelemetry Python SDK’s OTLP exporter performs a strict mapping from the internal Span objects to the wire-compatible OTEL schema (trace.proto).
This conversion happens in:
opentelemetry-sdk/trace/export/__init__.pyGenerated Protobuf classes like
trace_pb2.py🔁 Mapping Examples:
Python SDK Internal Field OTEL Exported Field span.context.trace_id"traceId"span.context.span_id"spanId"span.parent.span_id"parentSpanId"span.name"name"span.kind"kind"span.start_time"startTimeUnixNano"span.end_time"endTimeUnixNano"span.attributes(dict)attributes[](array of{ "key": ..., "value": ... })span.status{ "code": "STATUS_CODE_UNSET" }span.resourcelifted to resourceSpans[].resource
These mappings are not optional — they are required for the OTEL schema to be valid and for backend compatibility. All OTLP-compliant backends rely on these mappings to parse and process telemetry data correctly.
Mental Model of the schema
- Schema shape (fixed) → You cannot change the container structure
- Values inside (flexible) → You set fields like
name,attributes,status, and sometimesparentSpanId - Some fields are auto-filled → IDs, timestamps
- The only place for custom app data = attributes[].
- The values of standard fields (like name, status, etc.) you can set.
- The rest (IDs, times) = handled automatically by the SDK.
Minimal python code examples for getting the console output
1
2
3
4
5
6
7
8
9
10
11
12
13
14
15
16
from opentelemetry import trace
from opentelemetry.sdk.trace import TracerProvider
from opentelemetry.sdk.trace.export import SimpleSpanProcessor, ConsoleSpanExporter

# ConsoleSpanExporter here = Python dict view (not OTLP schema)
provider = TracerProvider()
exporter = ConsoleSpanExporter()
provider.add_span_processor(SimpleSpanProcessor(exporter))
trace.set_tracer_provider(provider)

tracer = trace.get_tracer("example")

with tracer.start_as_current_span("top-level-task") as parent:
    with tracer.start_as_current_span("sub-step-2") as child:
        child.set_attribute("foo", "bar")
        child.set_attribute("answer", 42)
Trace Context Propagation Across Distributed Systems: How It Works
Distributed Tracing Across Services Imagine a typical request flow in a distributed system:
1
2
3
4
Client ──> Server A ──> Database 1
                   └─> Server B ──> Database 2
Response <────────────
- Goal one trace across this entire journey.
- That means the traceId must be the same everywhere.
- Each service adds child spans.
This is easy if it were happening in the same system and could have been achived via nested span but here its a distributed system spread across network
How this happens:
👉 The “secret sauce” is Context Propagation.(HTTP headers injection) When the client makes a request, OTEL generates:
traceId(shared by all spans in this request)spanId(unique per span)
The client injects this context into the HTTP headers.
The server extracts it, continues the trace, and adds child spans.and injects it again if it makes other child calls to different other servers (app oe db whatever)
Standard = W3C Trace Context headers:
1
2
traceparent: 00-<traceId>-<spanId>-01
tracestate: ...
Example End-to-End in Action
- Imagine this flow:
- Client app starts a trace →
traceId=abc123. - Makes HTTP call → adds header:
traceparent: abc123/111. - Server A extracts context → continues trace with a child span.
- Server A queries DB → creates a new child span for the SQL query.
- Server A calls Service B → propagates
traceIdin headers. - Service B extracts → creates its own child spans.
- Response bubbles back to the client.
- Client app starts a trace →
- Imagine this flow:
👉 Result in Jaeger:
You see a waterfall of spans across
Client → Server A → Service B → DB — all connected by the sametraceId.
Who Actually Handles Trace Context Propagation?
- Raw HTTP server (no OTel instrumentation)
A server (Flask without OTel, Node.js http.createServer(), Go net/http) does not know whattraceparentmeans.
It just treats it as a normal HTTP header.
So:
1
2
3
- Client starts a trace → sends traceparent.
- Server ignores it → starts a new trace (or no trace at all).
- ❌ The two traces are disconnected.
- With OpenTelemetry Instrumentation
OTel instruments your framework/middleware (Flask, Django, Express, Spring, gRPC).
- On incoming requests:
The instrumentation extracts thetraceparent(andtracestate) header.- If found → continue the trace with the same
traceId. - If not → create a fresh trace.
- If found → continue the trace with the same
- On outgoing requests:
The instrumentation injects the current trace context intotraceparentheaders.
✅ This is how traces get stitched across services automatically.
- Manual Way (if no instrumentation exists)
If you’re using a custom server or an unsupported protocol, you can handle tracing manually.
Two steps:
Extract from incoming headers:
1
2
3
4
5
6
7
8
9
10
11
12
13
14
  from opentelemetry import trace, propagate
  from opentelemetry.trace import TracerProvider
  from opentelemetry.sdk.trace import TracerProvider
  from opentelemetry.sdk.trace.export import SimpleSpanProcessor, ConsoleSpanExporter

  trace.set_tracer_provider(TracerProvider())
  tracer = trace.get_tracer(__name__)

  def handle_request(request):
      # Extract trace context from incoming HTTP headers
      ctx = propagate.extract(request.headers)
      with tracer.start_as_current_span("server_span", context=ctx):
          # your handler code
          return "response"
Inject into outgoing requests:
1
2
3
4
5
6
7
8
9
10
11
12
13
  import requests
  from opentelemetry import propagate

  def call_downstream():
      headers = {}
      propagate.inject(headers)  # adds `traceparent` automatically
      response = requests.get("http://downstream-service", headers=headers)
        def handle_request(request):
            # Extract trace context from incoming HTTP headers
            ctx = propagate.extract(request.headers)
            with tracer.start_as_current_span("server_span", context=ctx):
                # your handler code
                return "response"