OpenTelemetry (OTel): Unified Observability, Simplified (Part 1)
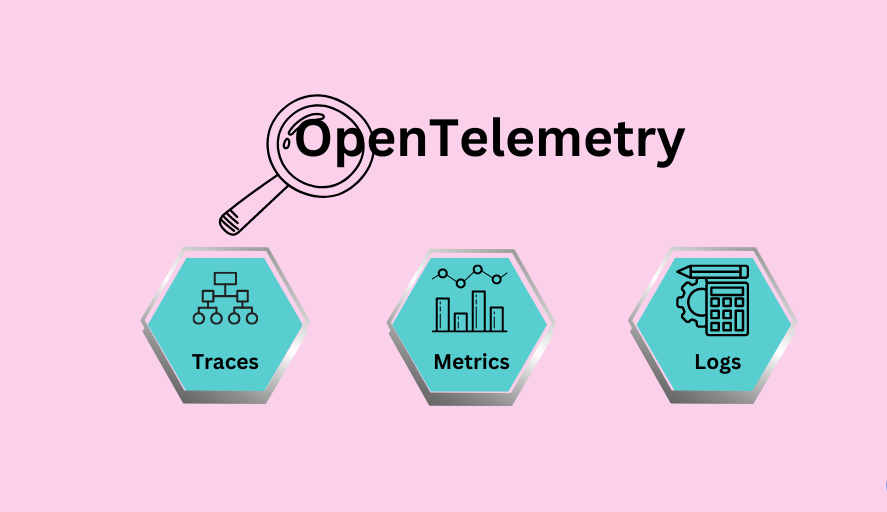
Table of Contents
Telemetry?
Telemetry is the collection, transmission, and measurement of data from remote systems or devices — so you can observe and analyze how they’re performing without being physically present.
In software and IT, telemetry refers to the data collected from applications, services, and infrastructure to understand their behavior, health, and performance.
OpenTelemetry (OTel)?
OpenTelemetry (OTel) is an open-source observability a Standard + protocol + implementation (SDKs) incubated by the Cloud Native Computing Foundation (CNCF), designed to provide a unified approach for generating, collecting, managing, and exporting telemetry data from software applications.
Think of it like HTTP: HTTP has a standard (RFCs), and any server/client that speaks HTTP can talk to each other. You don’t have to re-implement HTTP yourself — you use a library like
curl,requests, etc., or language-specific SDKs in OTel that help take away the hassle of implementing those standards manually.
Telemetry data in OpenTelemetry includes
traces,metrics, andlogs—the three fundamental pillars of observability.
Why Do We Need OpenTelemetry (OTel)?
In modern systems, we want to understand what’s happening inside our applications — how they behave, how they perform, where issues occur, and what users are experiencing. This understanding comes from telemetry data — traces, metrics, and logs — generated by the application itself (By developer or may be using custome logging if we decide to log a specific event or something).
Let’s break this down to understand the problem and how OTel solves it.
For simplification:
- Telemetry Producers: Apps and services that generate telemetry data (
logs,traces,metrics).- Telemetry Backends: Tools that ingest telemetry data to provide value — e.g., visualize metrics (Grafana), alert on anomalies (Prometheus), trace requests (Jaeger), or monitor infrastructure (Datadog).
The Nature of Telemetry Data (Before OpenTelemetry)
Before diving deeper, it’s important to understand that telemetry data isn’t inherently structured or tied to any specific format. It’s simply a concept — data that helps us understand what’s happening inside our applications.
This data can be as simple as logging a message like:
“App was called” — every time the application is triggered,
Or as complex as recording a full, structured trace of the entire request lifecycle:
App was called → hit the database → created a user → failed at a validation step → took 120ms total latency,
along with timestamps, status codes, error messages, and much more.
The point is:
There’s no enforced or universal way to generate or structure telemetry data.
We, as developers or a vendor, can log, trace, and structure and format telemetry data however they choose — which leads to inconsistencies between different applications and systems.
To make things more difficult, if you’re using a vendor-specific backend (like Datadog, New Relic, etc.), you often have to follow their telemetry structure — even if they provide SDKs. This creates tight coupling and a bottleneck:which is often refer to as vendor lock
Now imagine the problem.
Each application or service produces different telemetry data, or each vendor demands telemetry data in a different structure, using its own JSON format, naming conventions, and data flow styles. What a mess.
For example:
App A logs traces like:
1
{ "event": "db_query", "time": 123, "user": "42" }
App B logs:
1
{ "span": "query", "timestamp": 123, "uid": "42" }
Or, one vendor might need log like this:
1
{ "event": "app_called", "timestamp": "2025-08-18T10:00:00Z" }
While another might need log:
1
{ "action": "user_created", "latency": 250, "db": "hit", "status": "success" }
😬 If you send these app data to a dashboard (Datadog, Jaeger, New Relic, etc.), the backend can’t interpret both formats the same way. You’d need custom parsers for each format — a huge mess. 😵💫
🤯 Or, if you comply with vendor-specific formats, you have to learn and maintain them all — a huge mess. 😵💫
How OTel Solves it?
OpenTelemetry defines a standard schema + APIs (to produce those schemas without needing to understand them) for traces, metrics, and logs.
- Every language (Python, Go, Java, etc.) implements the same OTel spec(usually using the OTel SDKs).
- Your app creates telemetry using OTel APIs (SDKs).
- That telemetry has a well-defined structure.
Exportersserialize it (often JSON + Protobuf over gRPC/HTTP) → backend systems can read it (e.g., Prometheus, Jaeger, Grafana, Dynatrace, or any custom dashboard like Langfuse).- Developers no longer have to worry about creating or maintaining custom telemetry structures.
👉 Result: One universal format — every dashboard understands it. Every application sends it
What OpenTelemetry is (Nutshell)
You can think of OpenTelemetry (OTel) as three things combined:
-
A Standard (Schema + Semantic Conventions) [click me]
- Two Layers : Schema + Semantic Conventions
- Schema : Strict Structure (Defined in Protobuf) had dfined filed like
traceIdspanIdstartTimeUnixNanonamefor a trace schema (or data model).Backend requires exact fields to understand the telemetry is about (its a trace , metric or a log).The structure should not change the values in the atributes can change.- example
1
2
3
4
5
  {
    "traceId": "abc123",
    "spanId": "def456",
    "startTimeUnixNano": "1690000000000000000"
  }
- example
- Semantic Conventions: Flexible
Attributes(Key-Value Pairs) .Structure is open — any key, any value, BUT community agrees on semantic conventions for common fields. ex for a http methods the key will always be"http.method". any applicaiton can create there own conventions and can also aprse them as they want in theier own backend
- example
1
2
3
4
5
"attributes": [
  { "key": "http.method", "value": { "stringValue": "GET" } },
  { "key": "db.user", "value": { "stringValue": "admin" } },
  { "key": "custom.metric", "value": { "doubleValue": 42.0 } }
]
- Schema : Strict Structure (Defined in Protobuf) had dfined filed like
Defines what each telemetry looks like.(
trace,metrics,logs) The outer structure, The data model- Example: a trace must have
traceId,spanId,parentSpanId,name,timestamps,attributes, etc. - The same applies for metrics and logs.
- The keys are fixed by spec (you can’t rename
traceId→tracingit). - But you can add extra key-value pairs in
attributes.
OTel defines its standard through:
- Semantic Conventions: Documented specs for naming attributes (eg. attributes inside
tracedata model). - Data Models (the strict Schema): Described in OTel proto files. (how does a trace look like , how does a metric look like)
- Schemas (OTel Schema files): Optional files that help remap deprecated → current attribute names.
- Example representation
1
2
3
4
5
6
7
8
9
10
  Trace (Strict Schema)
    ├── traceId: abc123
    ├── spanId: def456
    ├── name: "HTTP GET /users"
    ├── ...
    └── attributes (Flexible, Semantic conventions)
        ├── http.method: "GET"
        ├── http.url: "/users"
        ├── db.user: "readonly_user"
        └── custom.key: "anything"
- Two Layers : Schema + Semantic Conventions
-
A Protocol (OTLP: OpenTelemetry Protocol) [click me]
Defines how telemetry is transmitted.
- Serialization = Protobuf (binary, efficient) or JSON (human-readable, but less common in production).
- Ensures exporters, collectors, and backends all speak the same wire format.
Canonical schema:
- The data model structures are defined in this file (not the Semantic Conventions i.e meaning of the key and values indide the attributes key inside a
tracemodels for example) - OpenTelemetry defines its schema in Protobuf
(trace.proto, metrics.proto, logs.proto). - That’s the wire format used by default.
JSON option:
- The OTLP protocol also supports JSON serialization as an alternative.
- Primarily used for debugging or simple HTTP-based backends.
- ✅ Yes, you can send the defined schema in JSON via HTTP (
Content-Type: application/json), and compliant OTel backends should accept it.
So — OTel is not only Protobuf. JSON is official, but Protobuf is preferred for performance. OpenTelemetry specification
-
APIs + SDKs (Implementations) [click me]
Let you instrument your code without worrying about schema details.
Example in Python:
1
2
with tracer.start_as_current_span("http_request") as span:
    span.set_attribute("http.method", "GET")
OTel’s Three Pillars: traces, metr ics, logs (ie.Data Models With Schemas)
OpenTelemetry standardizes three core types of telemetry signals, often referred to as the “three pillars of observability” or “telemetry triad.”: OTel defines one canonical schema for each signal type defined below:
Traces— What happened, in what orderMetrics— How much, how often, how longLogs— What was said
- These schemas are defined in OTLP Protobuf files ->
.protowithin the OTel spec , supporting bothprotobufandJsonformats.All compliant SDK and All compliant backend must use the same schema.- That’s why you can send telemetry from your Python app into tools like Jaeger,Langfuse, Honeycomb, and others — and they all understand it out of the box.
⚠️ Note:
The schemas shown in the subsequent sections are high-level representations
and come directly from the Protobuf definitions — just in human-readable JSON,not binary. Their structure strictly follows the official OTLP spec.
Traces 🕵️ — What happened, in what order
tracesA trace is the complete story of a single workflow — starting from a root span, followed by a series of nested spans (representing meaningful events or logged actions), and ending when the workflow completes.- A full story of a workflow (e.g., one user request).
- A trace tells the entire journey of that request across various services, functions, or components.It helps answer:👉 What happened? Where did it go? What took the most time? Where did it fail?
- Composed of spans, which represent individual units of work or step. Example analogy: A movie.
Span
A step inside the workflow.- Each span has a start + end, a name, duration, and metadata.
- Each Span can be nested
- Why: Breaks down the workflow into understandable chunks.
👉 Example analogy: A scene in the movie (may followed by some special effects).
Note here during nesting the trace ID or the contex is automatically passed to the child span if we are using OTel SDKs or else if not using SDK (which is very bad) we have to pass the Trace ID (the context) . context propagation is auto done with the SDKs
Example: Tracing a User Signup
Here’s how tracing would look for a user registration workflow: Trace: User Signup Request
1
2
3
4
5
6
7
8
9
10
11
12
13
14
15
16
17
18
19
Trace: User Signup Request
└── Span : HTTP POST /signup (root span)
    ├── Span : Validate input data
    ├── Span : Write user to database
    │   ├── Span: Connect to DB
    │   ├── Span: Execute INSERT query
    │   │   └── Event: Query success
    │   └── Span: Close DB connection
    └── Span : Send welcome email
        ├── Span: Generate email content
        ├── Span: Call email service API
        │   └── Event: 202 Accepted (email queued)
        └── Span: Log delivery status
# movie analogy
Trace (full movie)
 ├── Span (scene 1)
 ├── Span (scene 2, special effect)
 │     └── Span (some event to capture)
 └── Span (scene 3)
Trace Schema trace.proto
The canonical structure is defined in file trace.proto. click to view it At a high level:
1
2
3
4
5
6
7
8
9
10
11
12
13
14
15
  ResourceSpans
  └── resource (describes service: attributes like service.name, sdk.version)
  └── scope_spans (groups by instrumentation library)
        └── spans[] (the actual spans)
              ├── trace_id
              ├── span_id
              ├── parent_span_id
              ├── name
              ├── kind (INTERNAL, SERVER, CLIENT, PRODUCER, CONSUMER)
              ├── start_time_unix_nano
              ├── end_time_unix_nano
              ├── attributes[] (key/value custom metadata)
              ├── events[] (timestamped annotations)
              ├── links[] (span links across traces)
              ├── status (OK, ERROR, UNSET)
Here’s how the above look when serialized as JSON.[click to view]
1
2
3
4
5
6
7
8
9
10
11
12
13
14
15
16
17
18
19
20
21
22
23
24
25
26
27
28
29
30
31
32
33
  {
    "resourceSpans": [
      {
        "resource": {
          "attributes": [
            { "key": "service.name", "value": { "stringValue": "checkout-service" } }
          ]
        },
        "scopeSpans": [
          {
            "scope": { "name": "otel.instrumentation.http" },
            "spans": [
              {
                "traceId": "4fd0c9e6e9c6bfb1a5f7d29d6c72b78f",
                "spanId": "6f9c2d7f8c4d1f32",
                "parentSpanId": "0000000000000000",
                "name": "HTTP GET /api/users/42",
                "kind": "SPAN_KIND_SERVER",
                "startTimeUnixNano": "1692288000000000000",
                "endTimeUnixNano": "1692288001000000000",
                "attributes": [
                  { "key": "http.method", "value": { "stringValue": "GET" } },
                  { "key": "http.url", "value": { "stringValue": "/api/users/42" } },
                  { "key": "net.peer.ip", "value": { "stringValue": "192.168.1.10" } }
                ],
                "status": { "code": "STATUS_CODE_OK" }
              }
            ]
          }
        ]
      }
    ]
  }
👉 This is the one and only trace schema. All SDKs produce spans in this shape, and all backends consume them.
Metrics 📈 — How much, how often, how long
Metrics are aggregated, numerical data points that represent performance, resource usage, or behavior over time.
They are lightweight, ideal for monitoring and alerting, and provide a high-level view of system health. Common Use Cases:
- How many HTTP requests per second is the app handling?
- What’s the 95th percentile response time?
- Is memory or CPU usage spiking?
- Examples: latency histograms, request counts, CPU usage, etc.
Metric Schema metrics.proto.
The canonical structure is Defined in metrics.proto . click to view it At a high level
1
2
3
4
5
6
7
8
9
10
11
12
13
14
  ResourceMetrics
  └── resource (service attributes)
  └── scope_metrics
        └── metrics[]
              ├── name
              ├── description
              ├── unit
              └── data (one of:)
                  • Gauge (instant value)
                  • Sum (counter / monotonic / non-monotonic)
                  • Histogram (bucketed distribution)
                  • ExponentialHistogram
                  • Summary (quantiles, deprecated)
Here’s how the above look when serialized as JSON.Metric (Histogram Example)[click to view]
1
2
3
4
5
6
7
8
9
10
11
12
13
14
15
16
17
18
19
20
21
22
23
24
25
26
27
28
29
30
31
32
33
34
35
36
37
38
  {
  "resourceMetrics": [
    {
      "resource": {
        "attributes": [
          { "key": "service.name", "value": { "stringValue": "checkout-service" } }
        ]
      },
      "scopeMetrics": [
        {
          "scope": { "name": "otel.instrumentation.runtime" },
          "metrics": [
            {
              "name": "http.server.duration",
              "description": "Duration of HTTP requests",
              "unit": "ms",
              "histogram": {
                "dataPoints": [
                  {
                    "attributes": [
                      { "key": "http.method", "value": { "stringValue": "GET" } }
                    ],
                    "startTimeUnixNano": "1692288000000000000",
                    "timeUnixNano": "1692288001000000000",
                    "count": "3",
                    "sum": 120.0,
                    "bucketCounts": ["1", "2"],
                    "explicitBounds": [50.0]
                  }
                ]
              }
            }
          ]
        }
      ]
    }
  ]
}
👉 Metrics are more diverse because telemetry can mean counts, gauges, histograms, etc. But again — this schema is fixed across OTel.
Logs 📜 — What was said
Logs are discrete, timestamped text records that describe events, messages, errors, or system states.
They’re highly detailed, context-rich, and excellent for debugging, auditing, and forensic analysis.
- What errors occurred during a specific request?
- What did the service try to do before it failed?
- What was the payload of the incoming API call?
- Discrete, timestamped records of events or errors.
- Can include raw text and/or structured attributes (e.g., key-value pairs).
Log Schema logs.proto
The canonical structure is defined in file logs.proto. click to view it At a high level:
1
2
3
4
5
6
7
8
9
10
11
12
  ResourceLogs
  └── resource (service attributes)
  └── scope_logs
      └── log_records[]
            ├── time_unix_nano
            ├── severity_number (enum: TRACE, DEBUG, INFO, WARN, ERROR, FATAL)
            ├── severity_text (string version, e.g., "ERROR")
            ├── body (actual log message, AnyValue type)
            ├── attributes[] (extra metadata)
            ├── trace_id (to link log → trace)
            ├── span_id (to link log → span)
Here’s how the above look when serialized as JSON.[click to view]
1
2
3
4
5
6
7
8
9
10
11
12
13
14
15
16
17
18
19
20
21
22
23
24
25
26
27
28
29
  {
  "resourceLogs": [
    {
      "resource": {
        "attributes": [
          { "key": "service.name", "value": { "stringValue": "checkout-service" } }
        ]
      },
      "scopeLogs": [
        {
          "scope": { "name": "otel.instrumentation.logger" },
          "logRecords": [
            {
              "timeUnixNano": "1692288002000000000",
              "severityNumber": "SEVERITY_NUMBER_ERROR",
              "severityText": "ERROR",
              "body": { "stringValue": "User not found: id=42" },
              "attributes": [
                { "key": "exception.type", "value": { "stringValue": "NotFoundError" } }
              ],
              "traceId": "4fd0c9e6e9c6bfb1a5f7d29d6c72b78f",
              "spanId": "6f9c2d7f8c4d1f32"
            }
          ]
        }
      ]
    }
  ]
}
Notice:
Logs can carrytrace_idandspan_id.
That’s how logs, metrics, and traces correlate in OpenTelemetry.
Conclusion
OpenTelemetry brings structure, consistency, and interoperability to the chaotic world of observability.
It allows developers to:
- Instrument once, export anywhere — no vendor lock-in
- Use one schema across all telemetry types (
traces,metrics,logs) - Automatically benefit from SDKs that abstract away schema complexity
- Connect all signals (e.g., link logs to traces via
trace_idandspan_id) - Standardize telemetry across microservices, languages, and platforms
By adopting OpenTelemetry, you build a future-proof and portable observability stack — decoupled from any specific vendor, but compatible with all.
Whether you’re building for debugging, monitoring, or business intelligence, OTel helps you generate clear, structured telemetry that every system can understand.